 Leticia Guzzetta, Sr. Technical Communications Manager, Cadence Design
February 15, 2020
Gathering and analyzing data to outline metrics can be a waste of time and effort if you don’t have a plan or goal of what you want to achieve with your metrics. It is just collecting meaningless data without a purpose. As leaders, we must define and show our capabilities and successes, which can be demonstrated via metrics or Key Performance Indicators (KPIs). Also, our metric messaging must be crisp, clear, meaningful, and targeted to achieve the results we aim for.
In short, it is about Messaging your story with a clear viewpoint and purpose. Like all good stories, you begin with an outline or a plan to achieve your goal. The outline becomes your framework of how you will define and shape your story.
For the framework of our metric story, we used 3 simple guiding principles:
- Who is your target audience?
- What do you want to convey?
- Who are we? Your accomplishments? Where do we want to be?
Of course, our basic framework are the typical basic technical writer questions. The critical question of who is your target audience and what do you want to share with them? What is the message you want to convey? Are you demonstrating your process and the improvements or are you justifying your resources requirements? Are you tracking quantity or types of quality?
The Audience of One
As you are gathering data and determining your goal and purpose of your message, determine “Who is your target audience”. Is your audience Executives, managers, or your manager? Is it Other Technical Communication teams or Non-Technical Communication teams? Is it the finance or IT teams?
Will this audience understand your story without you presenting? Do they know and understand what they are looking at or looking for? Will they understand your lexicon, your message, your perspective?
Perspective
Perspective is a key element when speaking to your target audience. Perspective is a way of thinking about something; we are influenced by our beliefs or experiences, or backgrounds. It is amusing when we try to reconcile an expected outcome with reality when it comes to perspective. Sometimes, reality and perception negatively collide. A message gets lost because we miss the target for our audience to understand and engage. We often make the mistake with the metrics that we are sharing. We assume that people have the same terms or the basic understanding of our work.
We also make the mistake again that our metrics will not be shared — a party of one. Often our metrics will travel up and up the hierarchy, and then sideways and downways. Will these team members (who are unaccounted for) understand the message? Will your message get distorted or mixed up? The distortion is through their lenses of perspective.
Social psychologists define there are four major theoretical perspectives(1). We will explore the basic principle. A theoretical perspective is a set of assumptions about reality that inform the questions we ask and the kinds of answers we arrive at as a result. A theoretical perspective can be understood as a lens (influenced by our background, study, beliefs) through which we look, serving to focus or distort what we see or present or how we present.
You must consider the perspective of your audience. Try to understand your audience to relate your content so they receive your message or your data in a meaningful way. As an example, we’ll explore two social examples of theoretical perspective.[1]
-
- The Six Sense, the movie – “I see dead people.”[2]
-
- Planet of the Apes, the novel by Pierre Boulle[3]
The film The Six Sense is a story of Cole Sear (Haley Joel Osment), a boy who is able to see and talk to dead people, and Malcolm Crowe (Bruce Willis), a child psychologist who tries to help Cole but Malcolm is one of the dead people. He doesn’t understand Cole’s perspective until he is enlightened. Cole is frightened of Malcolm until Cole understands Malcolm’s perspective — he thinks he is alive.
The novel The Planet of the Apes by Pierre Boulle is a story about a rich couple sailing alone in space, Jinn and Phyllis. They rescue and translate a manuscript from a floating bottle. The manuscript describes a tale of three human explorers from Earth who visit a planet orbiting the star Betelgeuse, in which great apes are the dominant intelligent and civilized species, whereas humans are reduced to a savage animal-like state.
Jinn and Phyllis find the story too fantastic; the idea of humans as speaking and civilized members of society as utterly unbelievable. We, the readers, discover that Jinn and Phyllis are civilized chimpanzees. Assumptions are made by us.
It is about perspectives.
Steering your Perspective
To better navigate other perspectives, do three simple things:
- Understand the requirements: what is the purpose of the metrics and the outcome
- Do a sample run with another employee or colleague to learn if your messaging is clear
- Walkthrough a draft with a target audience and listen to feedback. Do not try to explain or defend your work – just listen. This will be a very difficult task to listen to. To take in the feedback without emotion and attachment. To learn from the input to improve and enhance your metrics, your proper data gathering.[4]
What do You Want to Convey – Shaping Your Story
If strategy is the blueprint for building an organization, metrics are the concrete, wood, drywall, and bricks. A company, group, or team can easily lose sight of its strategy and instead focus strictly on the metrics that are meant to represent it.[4]
Everyday organization strategy can be hijacked by numbers. We have the tendency to mentally replace strategy with metrics. Somehow employees start thinking the strategy is to maximize survey scores or results rather than achieving the true goal.
To avoid this trap the suggestion is to use multiple metrics for your analysis to improve and drive your purpose. What do you want to convey? Do you want to measure your accomplishments? Initially define your goal and lay your foundation of your metrics. In collecting data and shaping our story, we laid the foundation but initially lost sight of our goal.
Our Story on Collecting Meaningful Metrics
We were tasked to show the health of our group and our accomplishments compared to the resources. We tried to lay the foundation to show how under staff we were. The initial request was to show how much work we have completed with our resources.
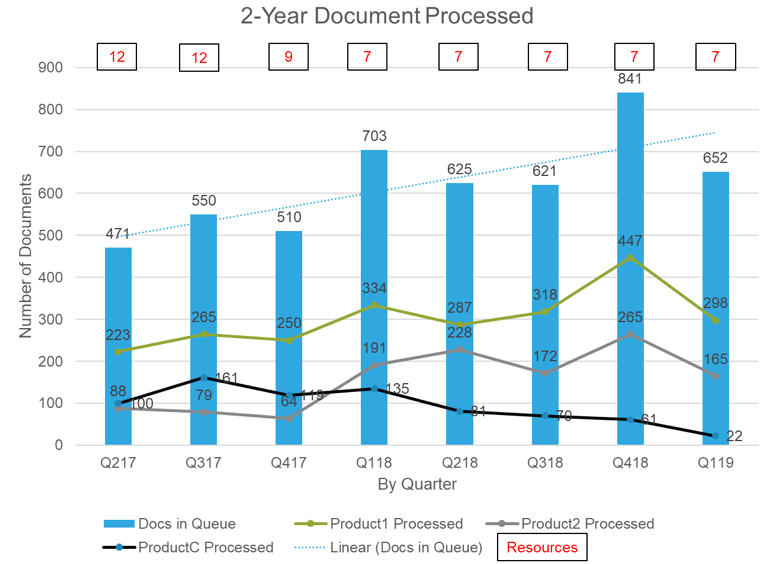
In our initial Document Status report (Figure 1), we showed that Q118 and Q418 we successfully completed our tasks with limited resources. We quickly realized we needed additional datapoints to show our reality. We had to improve a tracking system to show the tracking of our documents.

Figure 1: Initial Document Status Report
We used JIRA to track our workload. Not all JIRAs Are Alike!! Each JIRA needed to reflect the number of documents requested. Previously we were only tracking the number of requests rather than the number of documents. Modifying our data points and using multiple metrics improved our results.
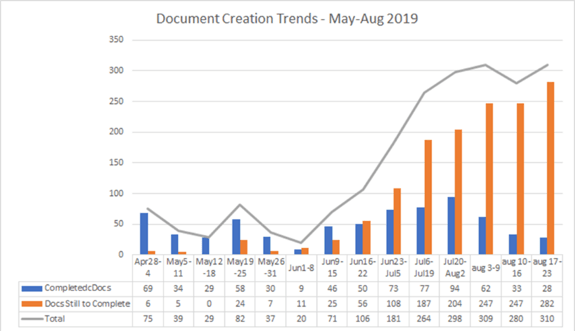
Using multiple metrics for our analysis, helped improve our report (Figure 2) and drive our point that we required additional support as shown. The document requests were greater than our output. This report enabled us to hire a contractor and we were funded for a CCMS.

Figure 2: Improved Document Status Report
What’s Next in Our Story
To meet our schedule, we need to show the process is followed that the timeliness and responsiveness are observed and keeping people accountable for their commitments. We began tracking inputs used to produce documentation such as MRD, PRD, power numbers, Engineering specifications, and Review feedback and Review approval.
Next for tracking is the input to my team to demonstrate whether we are getting the right information at the right time. Complaining does not work UNLESS you have metrics to demonstrate why you are running behind. Are we getting the right input at the right time? We used additional data points to hold the teams accountable for working with Technical Communications. We added dates to reflect when we needed our input and when we would be done. This type of data gathering improved our input. People responded to our metric sharing by improving their commitments to my team.
In our continuous improvement, we will investigate new data points, goals. We will explore the tracking of content reuse, quality (Explore content quality vs customer concerns), the impact of clear text and graphics, and lastly but not least technical accuracy.
Conclusion
We try to keep our story simple. Track the output results and input of content. We continue to build the foundation, so we may showcase our goals via meaningful metrics. The key points we use to clearly highlight our metrics are:
- Messaging, and know your target audience
- Identify the story you want to convey
- Test your report to ensure the message is clear
- Lastly, keep tracking and improving to ensure you are producing quality documents on time and not just producing metrics just because.
Whatever your message may be, remember these key points that I shared with you about our journey and trials and tribulations. Use these key points to collect and create the right data for your meaningful metrics:
- Who is your target audience?
- What do you want to convey? (goal/purpose)
- Who are we? Your accomplishments? Where do we want to be?
Resources
